Buffer placement
Compare buffer locations before moving physical stock.
- Map stations and WIP
- Test buffer locations
- Compare delivered output
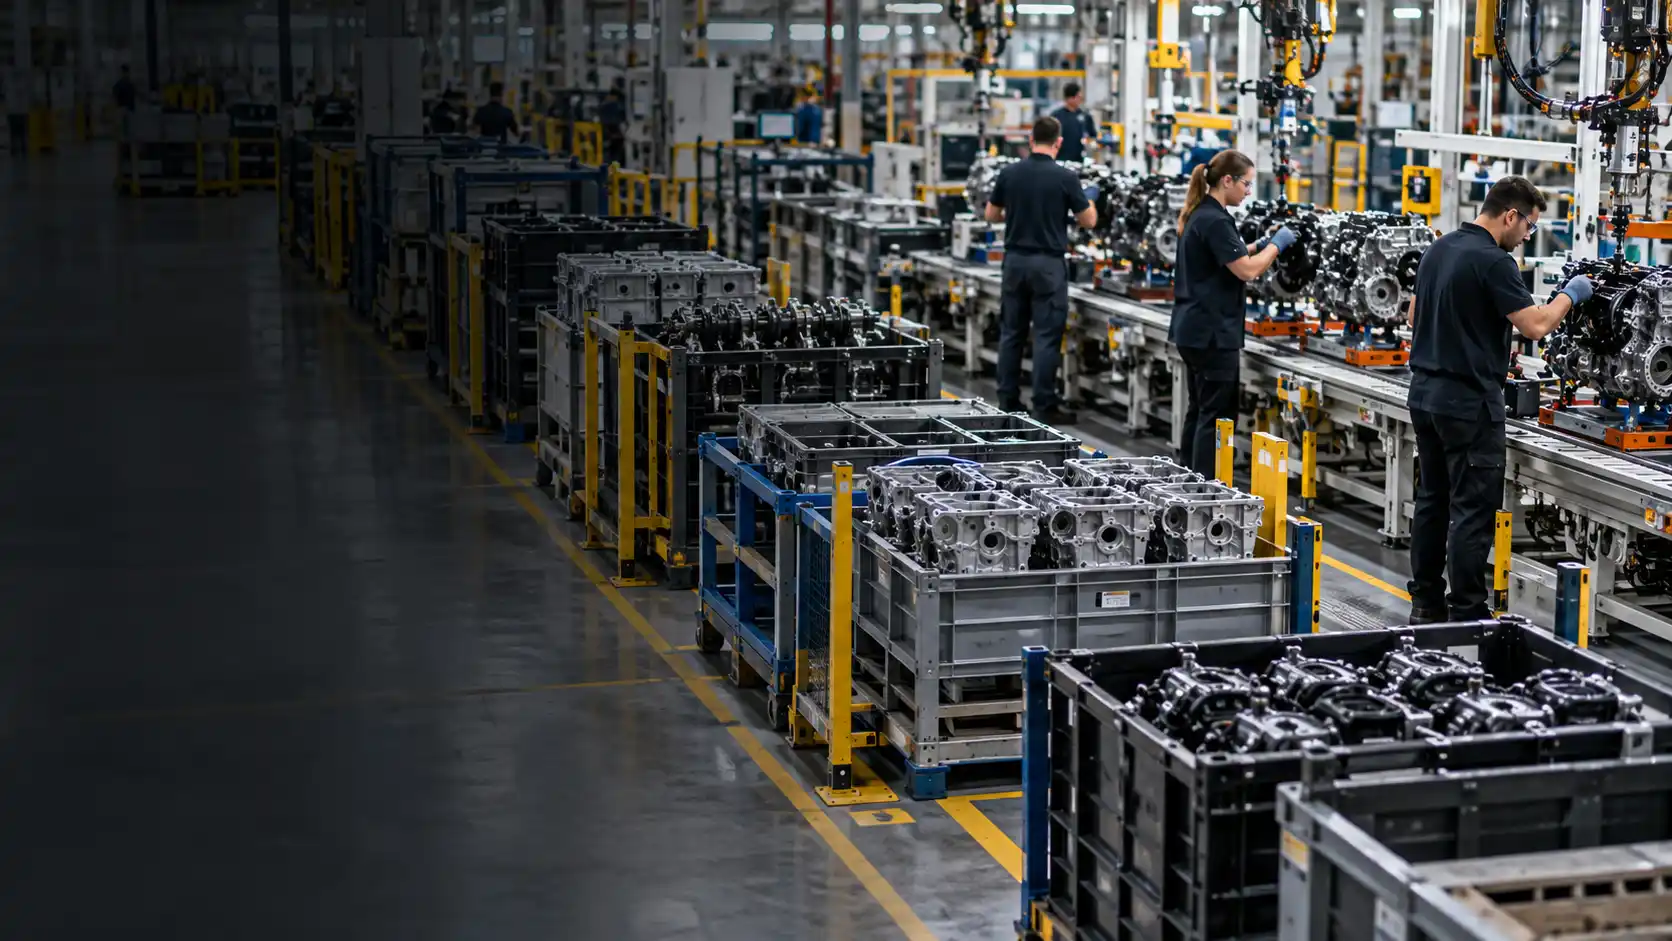
Protect the flow. Hold WIP with a purpose.
We test where buffer stock keeps a line running, where more stock stops helping, and what it may be hiding.
Too little WIP can starve a line; too much can occupy space and conceal interruptions. Explore five decisions behind an effective buffer using the cards or arrows below.
Buffer placement
Buffer size
Stop coverage
Replenishment
Mix & handovers
Compare buffer locations before moving physical stock.
Find the WIP level after which output barely changes.
Convert stored units into minutes of protected running.
Test when a refill starts and how long it takes to arrive.
Check protection across product and shift conditions.
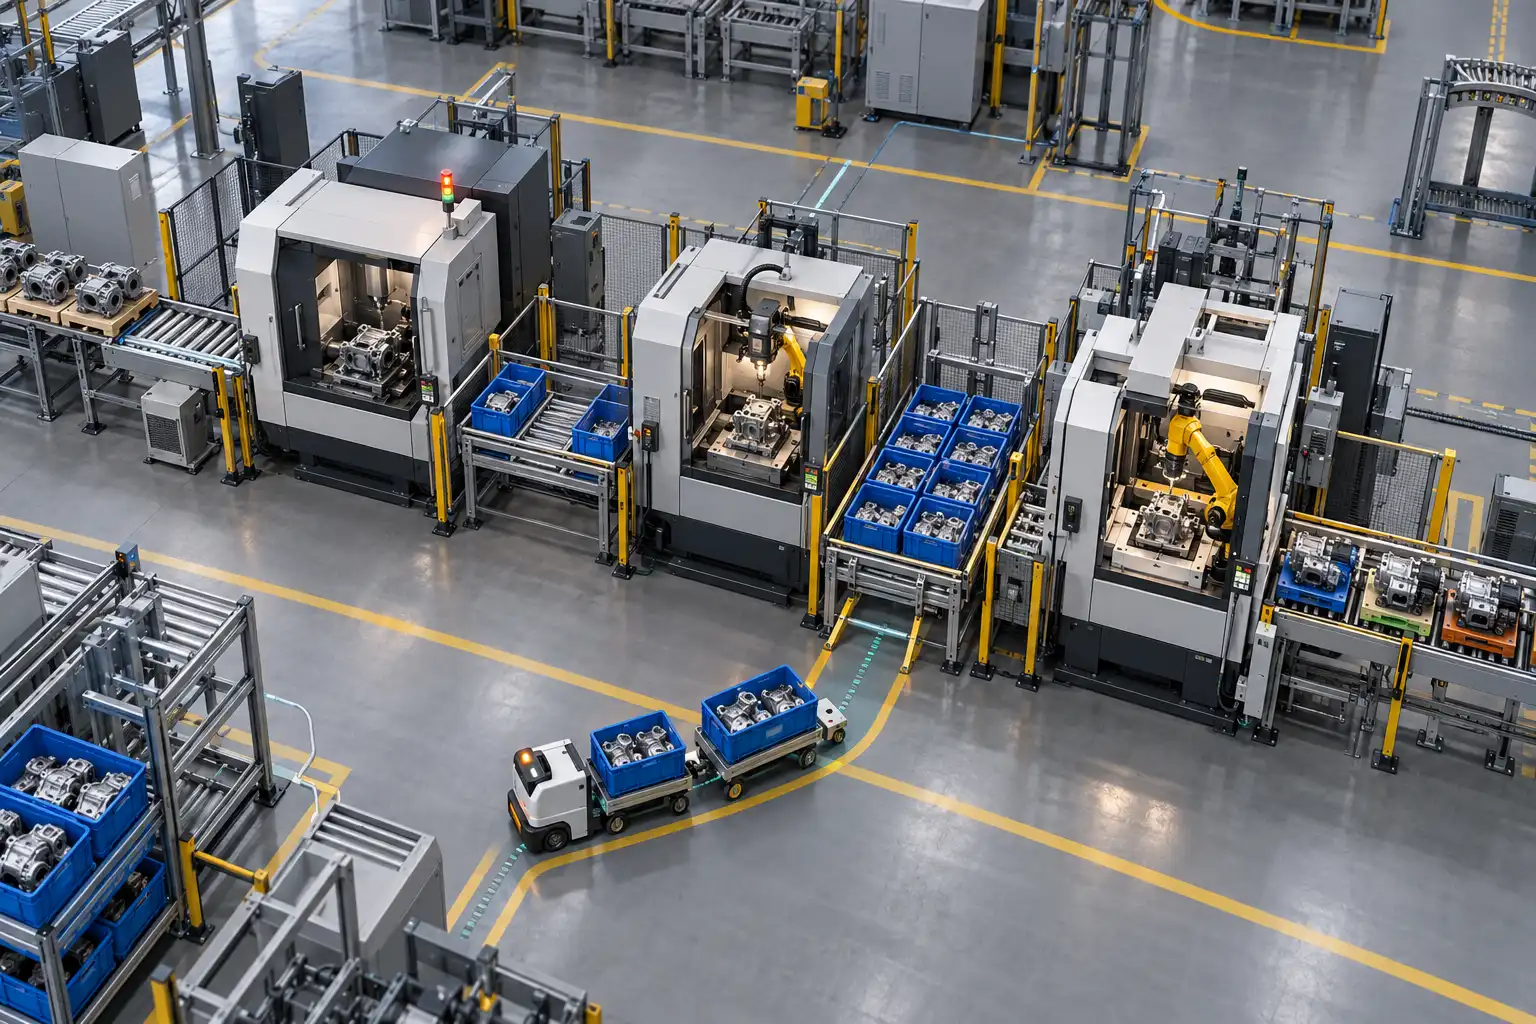
Explore all five challenges · Select a card or use the arrows
A buffer study makes the inventory–output tradeoff visible before changing physical stock levels on the floor.
See where stock protects output and where adding more has little effect.
Test removing or reducing each location and compare the effect on delivered output.
Know how long downstream work continues when an upstream process stops.
Compare when and how WIP is replenished before a line runs dry.
Distinguish useful protection from stock that masks a reliability or cycle-time problem.
A working simulation model + Scenario comparisons + Engineering recommendations
Decide where WIP belongs, how much is useful, and when it should be replenished. We test buffer policies against production variability before changing stock levels or floor space.
Explore our simulation project supportCompare delivered output across candidate buffer sizes to locate diminishing returns. We include variability and stops on both sides of the buffer so useful running protection can be distinguished from stock that adds little capacity.
Reduce or remove each buffer in the model and compare the effect on output and waiting. The findings help prioritize locations that protect flow and identify stock that may be compensating for a process or reliability problem.
Simulate upstream stops and measure how long downstream production continues before the buffer drains. We compare that coverage with replenishment and recovery times, expressing protection in running minutes as well as units held.
We define the sections of the line and the stock policies under consideration. Finite buffers are tested alongside upstream and downstream processes so reductions in WIP are assessed against delivered output, not inventory quantity alone.
Typical inputs include buffer locations and capacities, cycle-time variation, failure and recovery records, replenishment triggers and lead times, product mix, and shift handovers. We check how stock fills and drains in the current operation.
Depending on scope, receive output-versus-WIP comparisons, buffer-location rankings, coverage in running minutes, and replenishment recommendations. Findings distinguish useful protection from inventory that compensates for a reliability or flow problem.
With expert simulation consultation.
Tell us where the line starves, blocks, or accumulates stock. We’ll identify the buffer decisions worth testing.