Demand peaks
Stress the arrival pattern instead of a single average weekly volume.
- Model demand peaks and mix
- Test typical and busy periods
- See when queues build

Size for real demand. Know what the line can deliver.
We test stations, people, shifts, and machines against variation before you commit to the next capacity step.
An average output target hides the peaks, stops, and shared resources that determine usable capacity. Explore five challenges using the cards or arrows below.
Demand peaks
Station bottlenecks
Shifts & labor
Downtime & setups
Growth decisions
Stress the arrival pattern instead of a single average weekly volume.
Find the station that limits total output as demand changes.
Model handovers, breaks, and shared operators across each shift.
Include breakdowns, maintenance windows, and product changeovers.
Test added capacity in stages to learn when each option is needed.
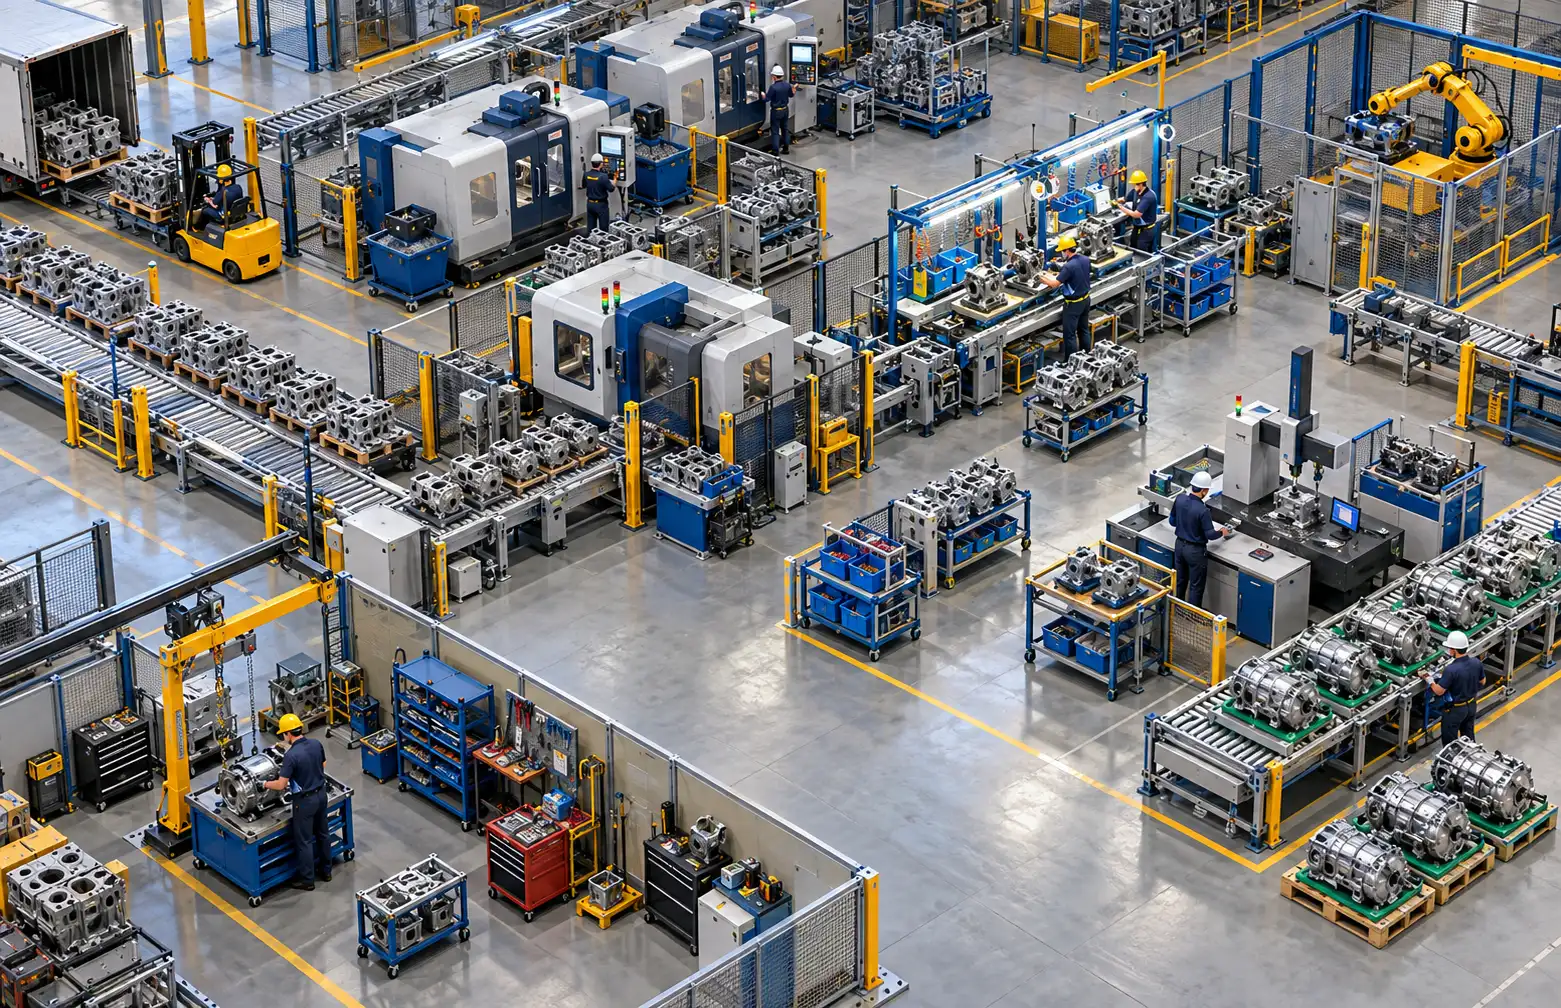
Explore all five challenges · Select a card or use the arrows
A capacity study gives your team a defensible plan for the demand and operating conditions you expect.
See the output range the line can sustain across typical and peak conditions.
Identify what limits throughput now and what becomes limiting after a change.
Compare staffing and shift patterns using the hours actually available to produce.
Test equipment, buffers, and operating changes before spending on more capacity.
Know the demand level that should trigger each next capacity step.
A working simulation model + Scenario comparisons + Engineering recommendations
Plan the next machine, shift, or expansion around the demand your operation must serve. We compare usable capacity and investment options before you commit.
Explore our simulation project supportCompare capacity additions in sequence, not only by machine count. We test your demand profile, identify the station or shared resource limiting output, and re-run each proposed addition. Findings show which constraint moves next and the volume that should trigger each step.
An added shift provides hours, but useful output depends on handovers, setups, maintenance, and available labor. We compare the proposed shift pattern with alternatives, such as added capacity across existing shifts, using the same demand and realistic operating losses.
Stress-test the arrival pattern with its peaks intact. We increase demand and vary product mix to see where stations, staging, buffers, or shared operators stop coping. The result is a set of operating limits rather than one nominal capacity figure.
The study starts with your output target, planned demand range, and candidate investments. We agree which line or network to model and include the shared labor, material supply, and downtime that determine usable capacity.
Typical inputs include demand by period and product, cycle-time distributions, setup sequences, machine availability, staffing calendars, and buffer capacities. We check assumptions against the current line before comparing capacity options.
Depending on scope, receive a working model, bottleneck and utilization analysis, and capacity scenarios compared on identical demand. Findings show the next limiting resource and the demand level that should trigger each investment.
With expert simulation consultation.
Tell us the demand and investment decision you are weighing. We’ll explore what a capacity study should test.