Events, not averages
Represent the operation as things that happen in sequence rather than as rates.
- Model arrivals, service and release
- Keep the sequence, not the average
- Let the clock do the arithmetic
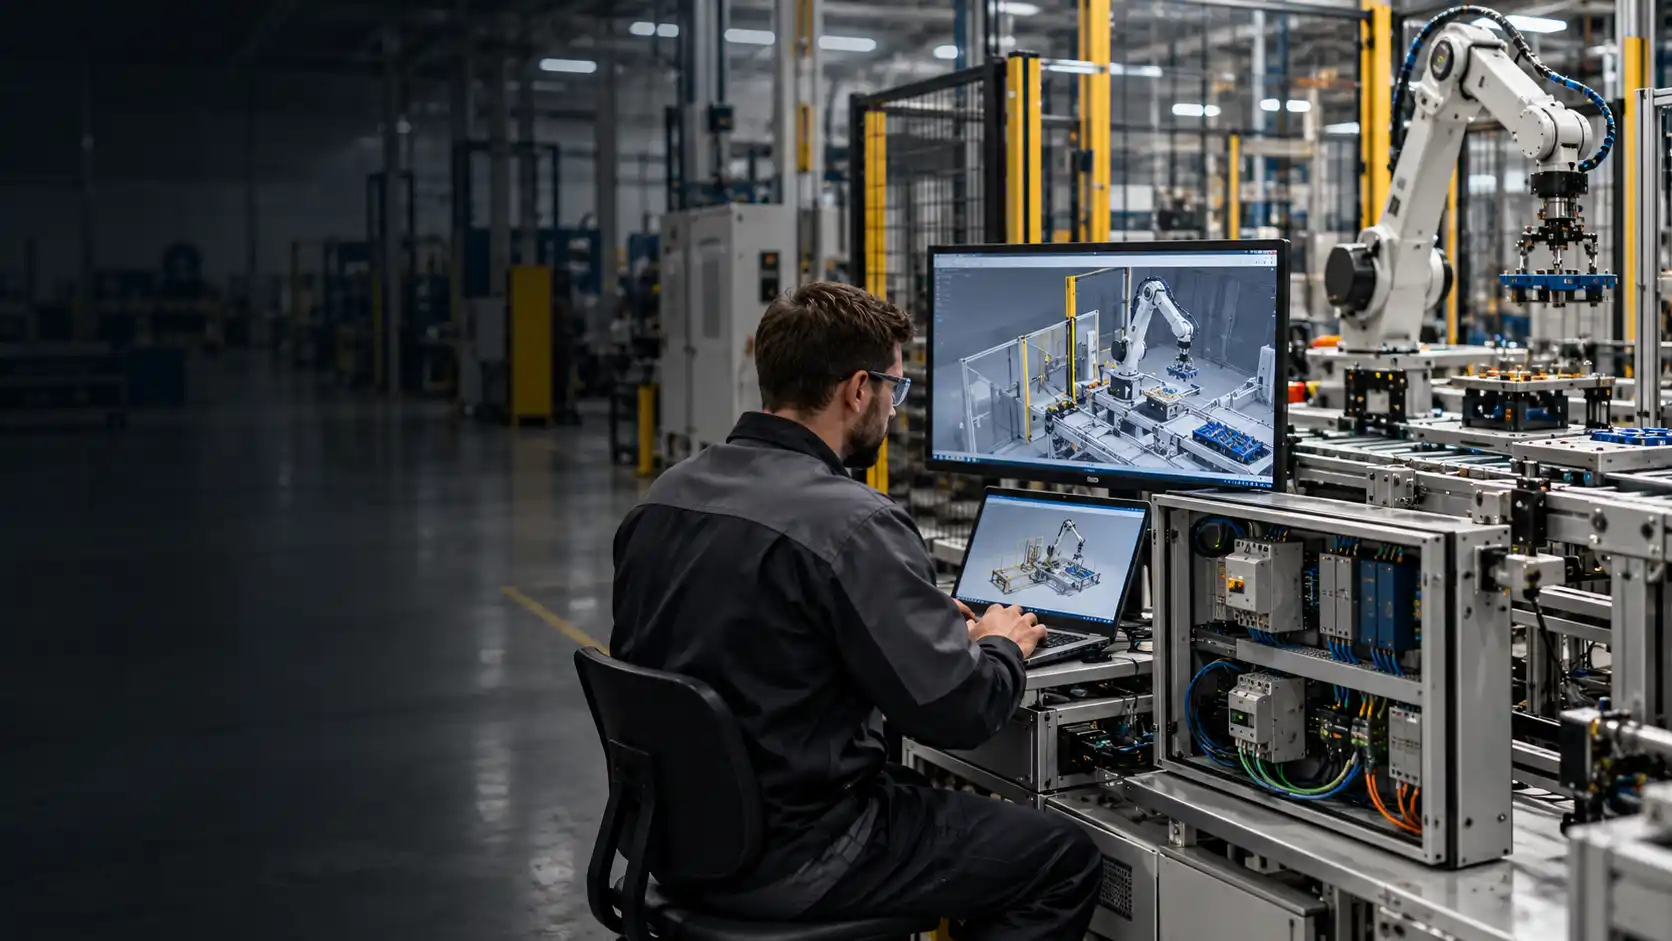
Run the operation before you build it.
Represent an operation as events in sequence and run it over time, carrying queueing, variation and contention for shared resources through the whole run.
A spreadsheet averages away the things that decide whether an operation copes. Explore five things a discrete event study has to get right, using the cards or arrows below.
Events, not averages
Variation and queueing
Shared resources
Run length and warm-up
Reading the output
Represent the operation as things that happen in sequence rather than as rates.
Carry variation through the run so queues form where they really would.
Make contention explicit where people, trucks or equipment are shared.
Run long enough, and often enough, for the answer to be stable.
Report what the model supports, with the uncertainty around it.
Explore all five challenges · Select a card or use the arrows
Discrete event simulation answers questions that depend on timing and contention, which a static calculation cannot represent however carefully it is built.
An operation that runs rather than a calculation that balances, so queues and starvation are visible.
Arrival and service variation kept in the run instead of averaged away before it matters.
Shared people, vehicles and equipment modeled once, with the waiting they cause attributable.
Outcomes reported as a spread across replications rather than a single run read as fact.
A representation the next question can be asked of, not a one-off calculation.
Working FlexSim model + Experiment results with ranges + Documented assumptions and limits
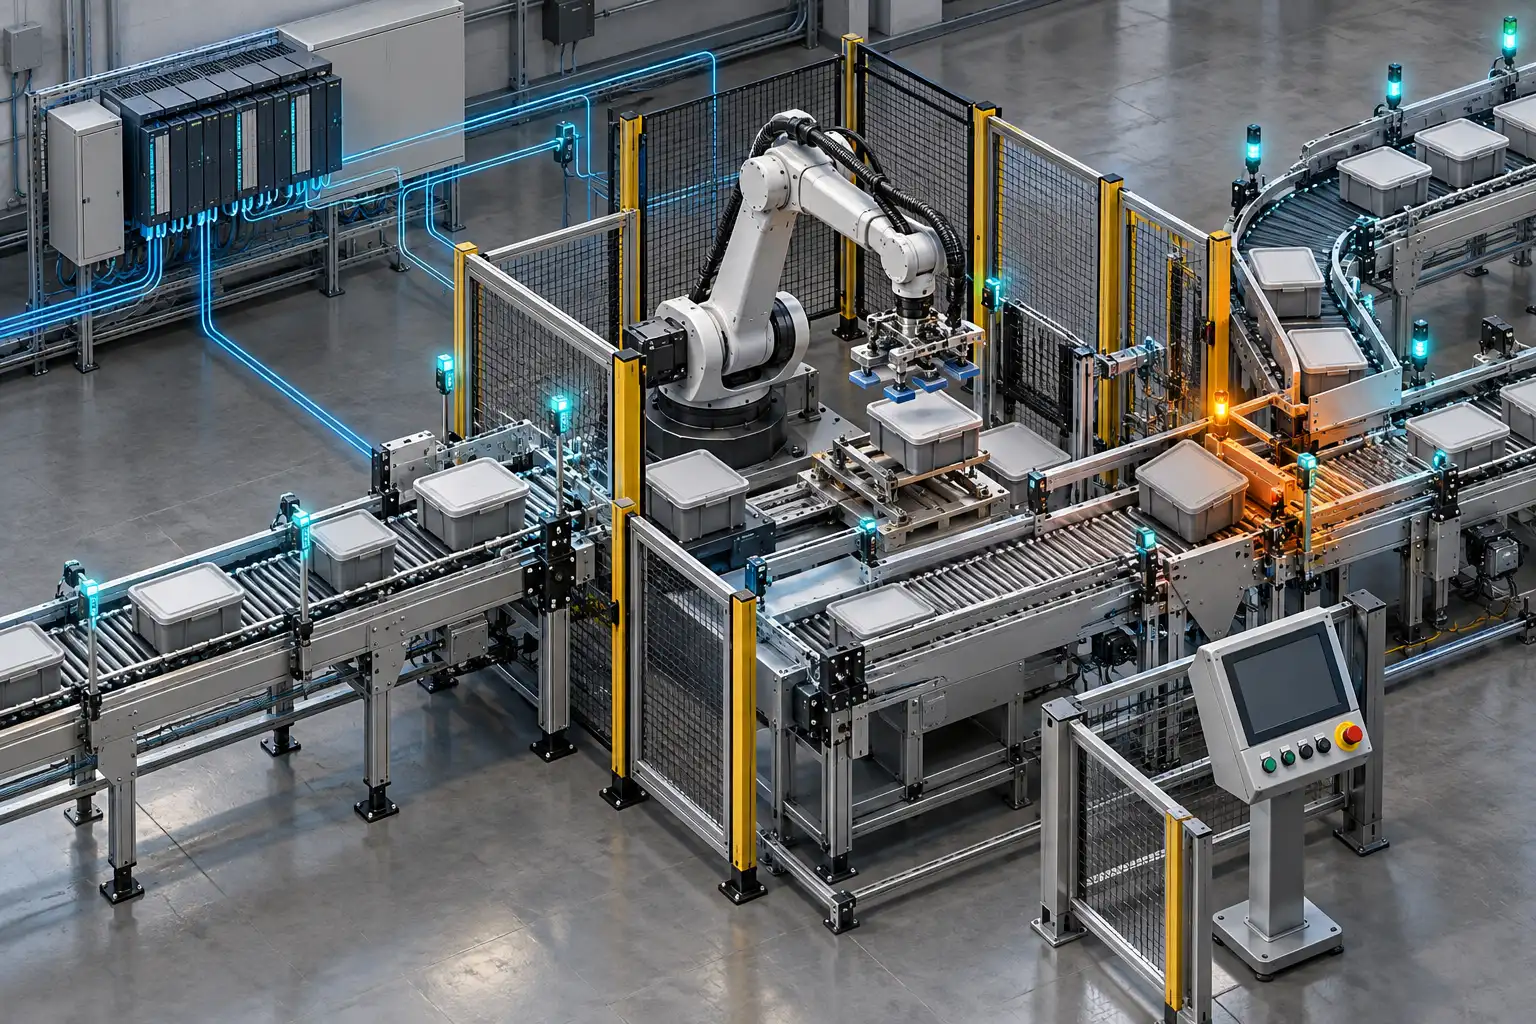
We build the operation as events in sequence — a part arrives, a machine is busy, a truck waits for a dock — and run it over time. Queueing, variation and contention are carried through the run rather than averaged out of it.
FlexSim simulation support & consultingA static calculation balances rates and tells you the average is fine. It cannot show a queue forming while a resource is busy elsewhere, or an operation that copes on average and fails on the days that matter. Timing and contention are the reason to simulate; where neither is present, a spreadsheet is the better tool and we will say so.
Arrival patterns, process times and breakdowns are entered as distributions where the data supports it. Replacing them with averages removes precisely the behavior the study exists to examine, because queues are caused by variation rather than by insufficient average capacity.
Where operators, vehicles or equipment serve several areas, the resource is modeled once and the rules that decide who gets it are made explicit. This is usually where an operation’s real waiting comes from, and it is the part a per-area calculation cannot see.
We discard a warm-up period so results are not taken from an empty system, replicate each scenario with different random seeds, and check the output has stabilized. A single run is one sample of a variable process and is not by itself a result.
Typical inputs are the process and routing, cycle or service times, arrival or demand profiles, shift patterns, downtime and changeover behavior, and resource counts. Where an input is unavailable we agree an assumption, record it, and test how much the answer depends on it.
Every model has a boundary. We state what sits outside it, which behaviors were simplified, and which conclusions the model supports, so it is used for the questions it can answer rather than the ones it merely appears to.
With expert simulation consultation.
Tell us the operation, the decision the model will support, and what data exists today. We’ll set out whether simulation is the right tool and what a study should cover.